ADA Cardano Possible *LONG* Double Bottom after BTC Flash CrashThis is simply a speculative observation, since the markets are quite unpredictable right now and TA is far from insurance.
But ADA appeared to have defended support last night amidst the market blunder, and in the process formed a double bottom which *typically* is an indicator of possible short
to medium term run up.
This idea is further strengthened by the RSI and MacD levels on virtually all time frames.
Again, ADA will have to hold this support line or this idea will become invalidated. But if it does, we may just see new highs, if the run this past week was any indicator.
I would personally wait a bit for the market to stabilize before making a solid decision on possible entry.
Good luck and happy trading.
Search in ideas for "ada cardano"


ADA (CARDANO) RETIREMENT SETUP - MACRO ANALYSIS - $35
This is the macro view of the daily timeframe analysis
I have already aped in BINANCE:ADAUSDT and already set a limit order below to DCA around the 60 - 80% Fib (see daily timeframe for context). This whole idea is invalidated one price retrace 100% from the last low created on the 10th of June 2023 which serves as the stop order. If average entry be $0.45, BINANCE:ADAUSDT should print at least 500% coming Alt Season.
What do you think? HOPIUM OR COPIUM?
OTHER ANALYSIS

ADA/ CARDANO forecastNew to Trading/crypto trading. ADA/Cardano is looking to have a bullish falling wedge? any tips/advice would be great!

ADA (cardano) - Short-Term Sell SetupADA (cardano) - Short-Term Sell Setup
Price completed a very nice short-term sell setup as we can see from the pattern.
Considering the overall market conditions we can see the price moving
even lower these days.
The current move is very small and it is in line with the bigger picture.
The support zone near 0.3390 can push the price down again.
Thank you and Good Luck!

ADA | Cardano | Simple Range Trading StrategyADA | Cardano | Simple Range Trading Strategy
Price is testing again the lowest part of a historical structure located
near 0.4000
The support area is giving us the possibility to join the bullish wave
that may come during the coming days.
PS: A price movement below the support area will invalidate this trading idea.
Given that the price is within this major correction for a long period of time
the bullish move should be aggressive.
Targets:
🎯 0.573431
🎯 0.663290
Thank you and Good Luck!

ADA CARDANO - READY TO CHECK 0,52$ AGAINSupport checked and it looks strong.
A new rise to 52 cents and a third check might even do the trick and experience a flight towards to 1$ mark.
If 0.47 is lost then this idea is not valid..we use stop losses here.
one Love,
The FXPROFESSOR

ADA CARDANO - Mini Chart UpdateThese are our key updated charts with most likely scenarios and key levels.
Remember to do your own research.
BTC is under Major Resistance and the Feds are approaching with a rate hike on Wednesday (unknown in quantity).
On the other hand, some see RSI in low levels and believe a rebound can happen.. we think it's difficult for now
One Love,
the FXPROFESSOR

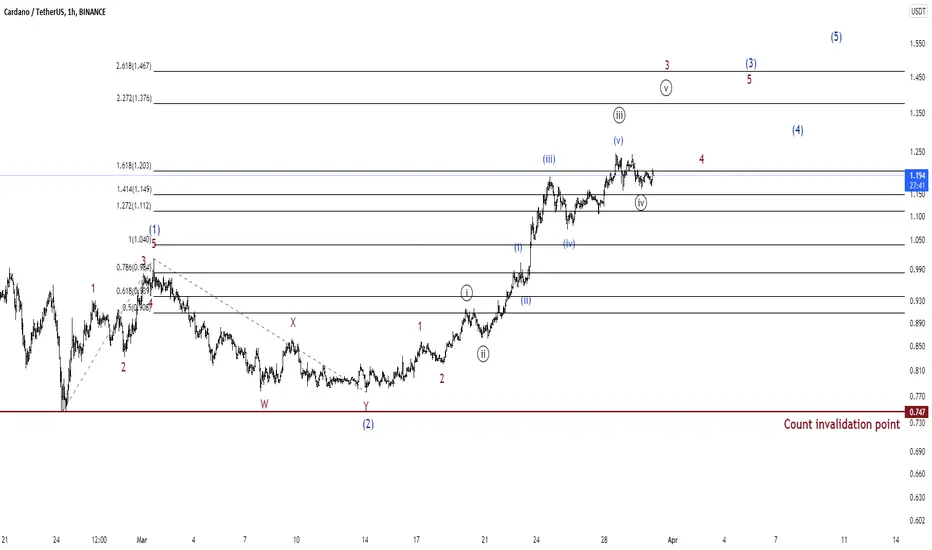
ADA-CARDANO Elliott Wave countIf this is the correct count for ADA Cardano than it can easily reach 1.5 USDT
ADA Cardano to 3.5$ in June/July A ascending triangle is up to be broken. If we see a breaking uptrend the target is above 3$. If the momentum of the market continues we can see ATH this summer, starting the rising in May/June/July

ADA Cardano Trade ideasCritical area to put in a bottom near the .90 area, a break down could lead to a waterfall to sub .50
Must break and retest the down trend line to show possible bottom and continuation to 1.50+

Ada | Cardano Heatmap based on Price, Support and resistanceFirst of all, you can find the areas used in the analysis chart by looking at the chart below.
My thought for the current situation is that it enters the green area and tries to create a support area for itself there. (3 Candle rule) .
The green circle can be considered as the necessary safe zone for the trend.
The green ring below the green circle is the last support zone for the Trend. A breakout of this zone may suggest that the trend is over.
Gann Boxes and Big green circles are designed in a way that I think will work as a trend timeframe.
As long as these circles placed in the Fibonacci channel are in harmony with the Fibonacci levels, there is no problem.
If prices fail to enter that green circle and the yellow and green waves break respectively, the orange fibonacci ring will act as support.
If the trend continues up as we predicted, this time these yellow and green rings will work as resistance.
Crossing the rectangular yellow area, i.e. going beyond the radius of the green circle, will confirm the trend even if prices haven't risen much.
Note: This is not investment advice.

Ada - Cardano (the 1.88 buy zone)As analysed about the potential buying zone my trade got triggered out above levels are upcoming resistance
Will keep trailing sl little bit conservative rather than aggressive

ADA CARDANO- Our Updated ChartOver resistance and looking good to buy!
The next level (of 1.40) will be key to break as over it the 1,70 mark will start coming closer and closer.
One Love
the FXPROFESSOR


ADA Cardano Possible Long Trade Feel free to like if you agree with my idea, and let’s hear your questions in the comments. Appreciate you guys.


Maybe ADA cardano after the big crypto hit.Ada cardano is a very new market, ever since it got out it made stairs if you zoom out a little more, after this big market crash this crypto will make its stairs again and will eventually i think hit x10 at the end of the year.

Ada Cardano Usdt Buy And Sell TargetsWe are Practice with new Methods,, please Buy in Spot,,, Thank You.... Ada Cardano Buy And Sell All Targets

ADA (Cardano) Either Breaks Out Big Here or Goes Back in Channellet's see what happens. i'm guessing it's going to go back to bouncing around in the channel, because i'm not that lucky

ADA CARDANO- Buying this dip with careThe dip happened, support was found but you need to be aware in case it's broken down for a second time.
Updates will follow
